
Table of Contents

Executive Summary
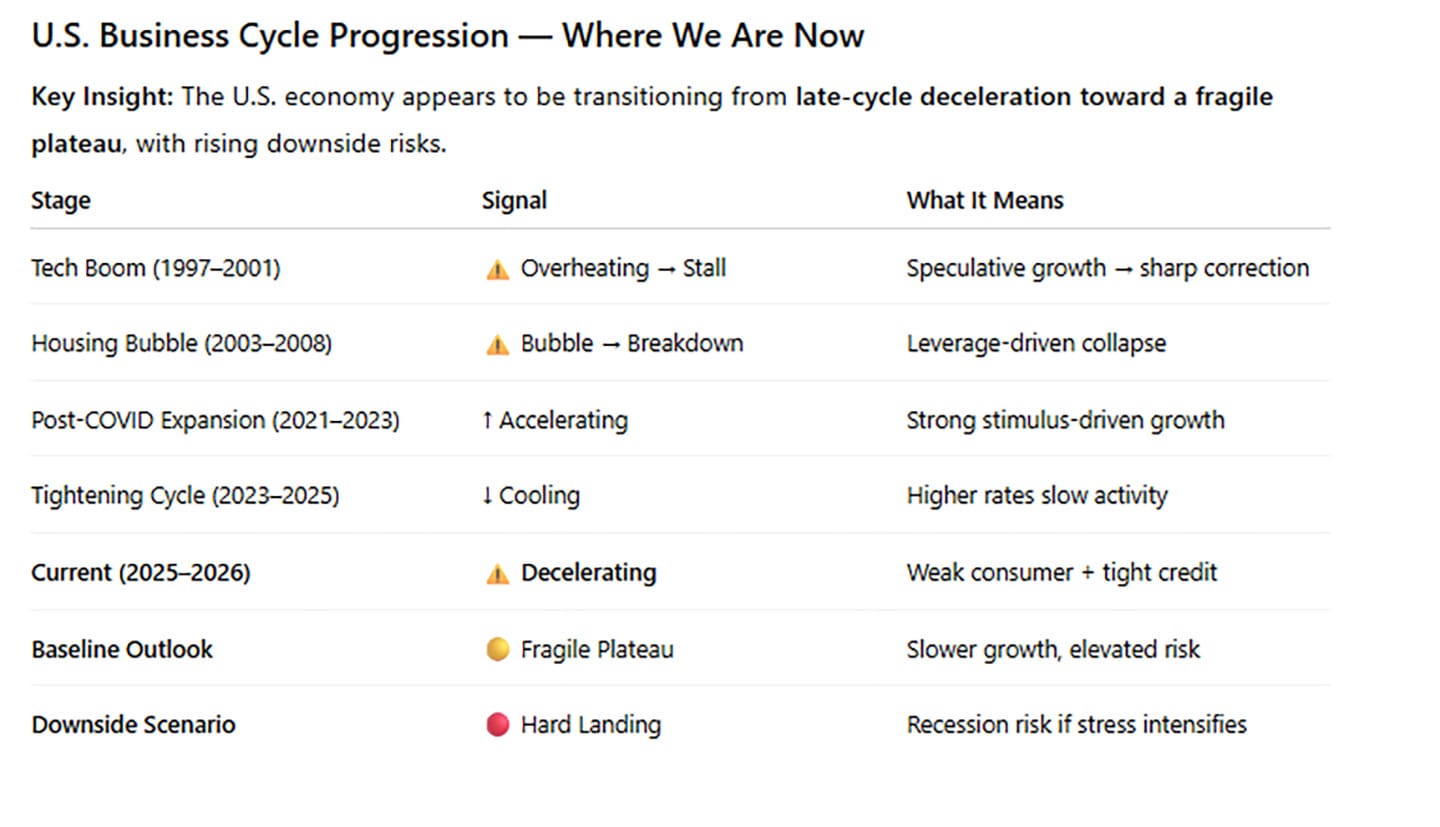
The U.S. economy remains in expansion but is entering a more vulnerable, late-cycle phase. Recent declines in household savings, persistent yield curve inversion, and rising CRE refinancing risks indicate a shift from stable expansion toward increased macroeconomic vulnerability. While growth continues, weakening household fundamentals, tight financial conditions, and elevated geopolitical risks increase the likelihood of slower growth over the next 6–18 months.
Consumer savings are low, debt levels are rising, and borrowing costs remain elevated. At the same time, the persistent inversion of the yield curve and ongoing stress in commercial real estate suggest tightening credit conditions ahead. Geopolitical tensions—particularly in the Middle East—introduce additional upside risks to inflation through potential energy market disruptions.
Although a recession is not imminent, the balance of risks has shifted. A more cautious and defensive investment stance is warranted.
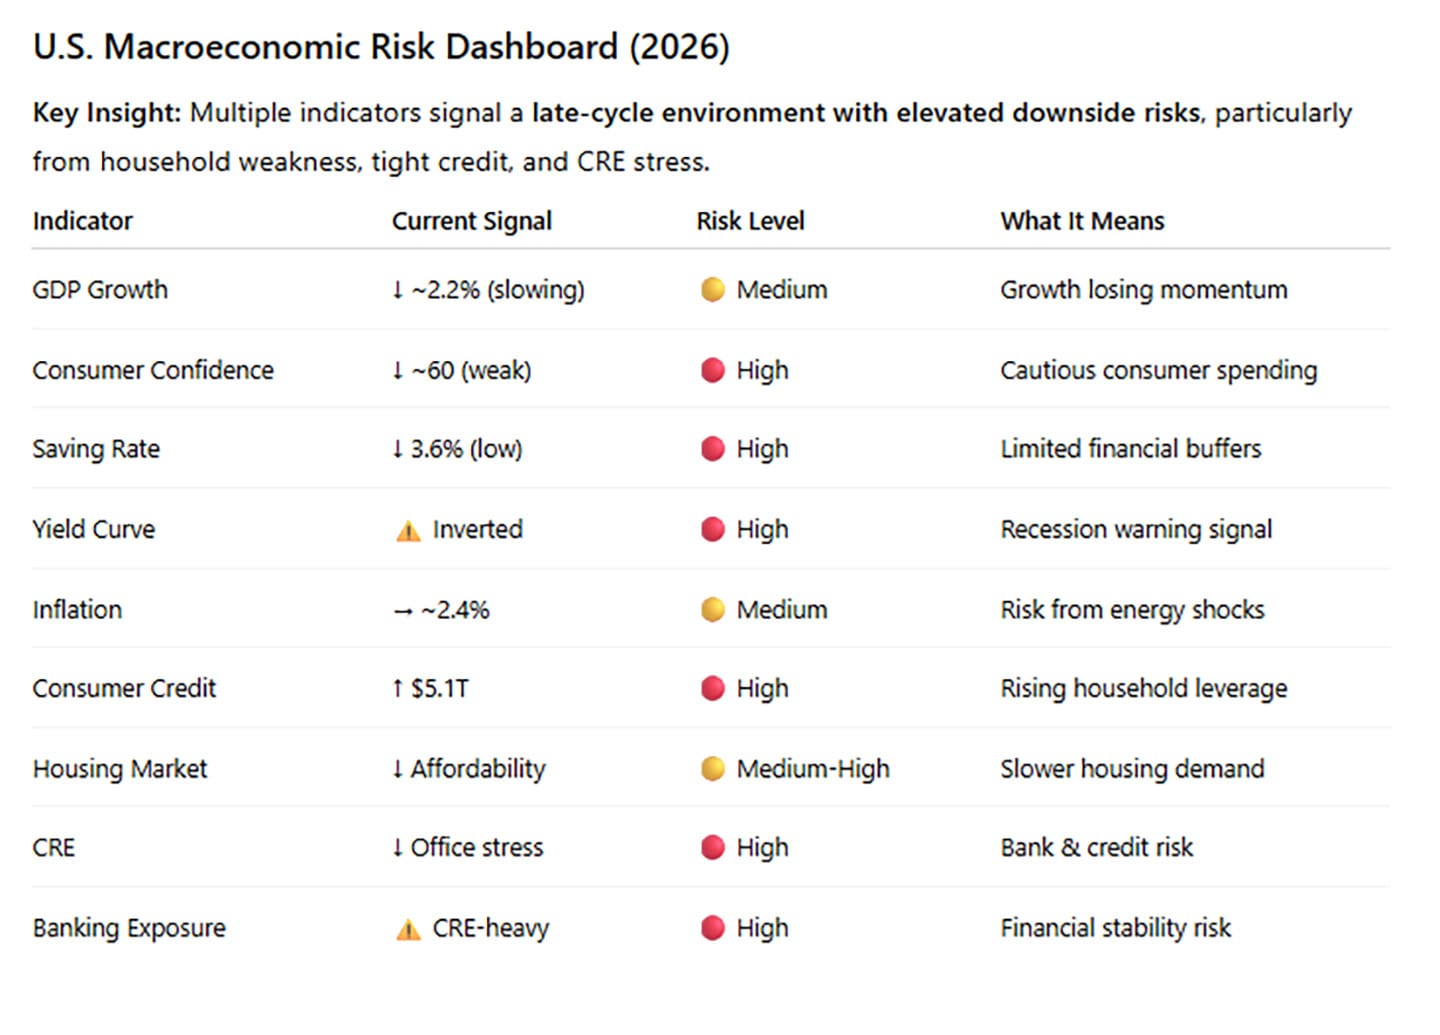
Current State of the U.S. Economy
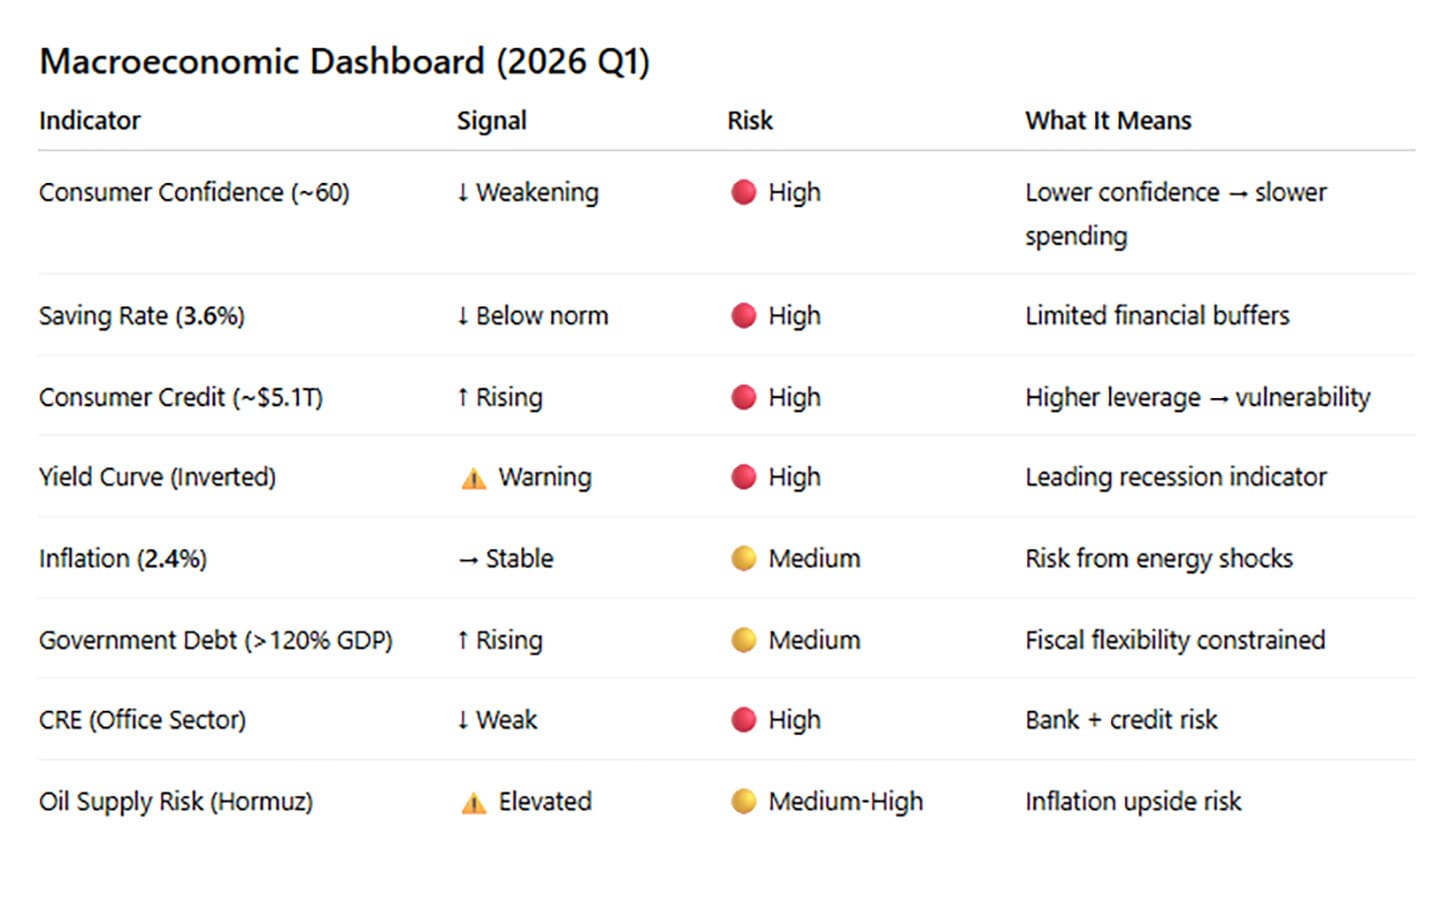
Economic activity remains positive but is gradually moderating, with several indicators pointing to a loss of momentum:
Consumer Confidence: Declining sentiment suggests households are becoming more cautious in spending.
Personal Saving Rate: Approximately 3.6%, well below the historical 6–8% range, indicating limited financial buffers.
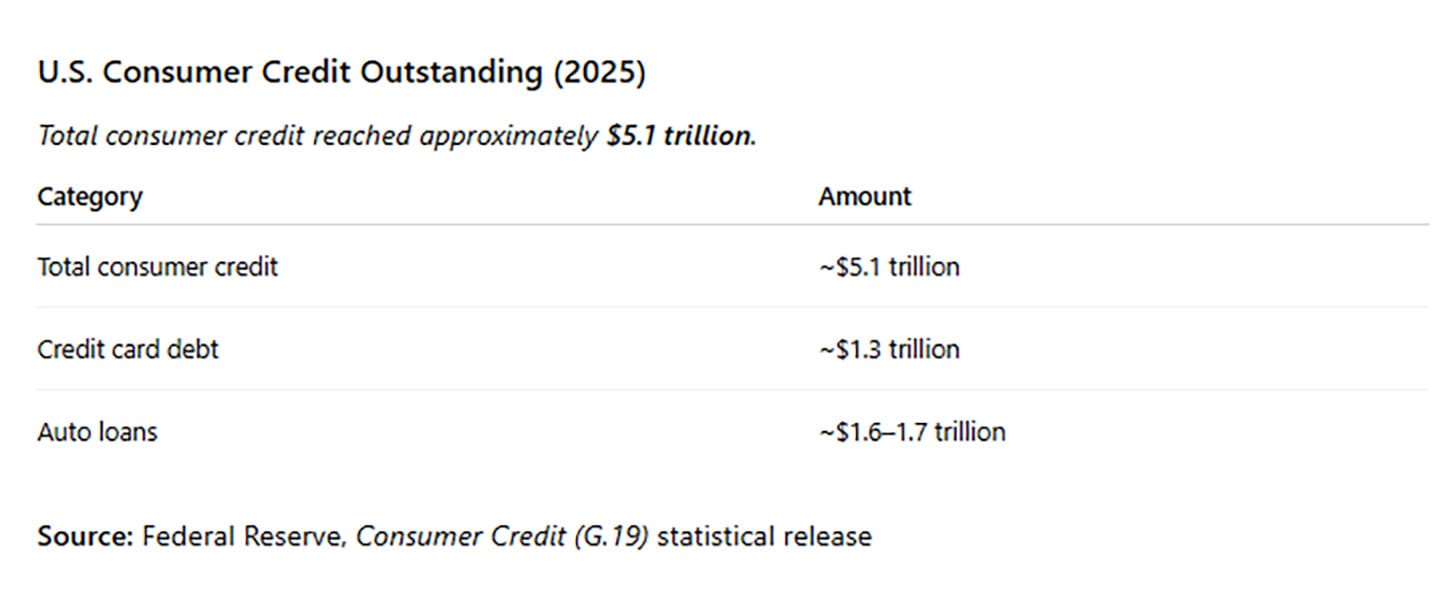
Consumer Credit: Rising debt and higher borrowing costs are likely to constrain consumption.
Yield Curve: Inverted since October 2025—historically a reliable signal of slower growth within 6–18 months.
Inflation: Moderated to ~2.4%, though vulnerable to renewed pressure from energy markets.
Government Debt: Exceeds $35 trillion (>120% of GDP), increasing fiscal constraints.
Commercial Real Estate (CRE): Office sector weakness continues to pressure valuations and lending conditions.
Energy & Geopolitics: Middle East tensions present risks to global oil supply and inflation.
Key Macroeconomic Risks and Transmission Channels
Several interconnected risks are shaping the near-term outlook:
Household Vulnerability: Low savings and rising debt increase sensitivity to economic shocks.
Fiscal Constraints: Elevated government debt limits policy flexibility.
CRE Stress: Refinancing risks and declining valuations may pressure regional banks.
Geopolitical Risks: Energy market disruptions could drive inflation higher.
Risk Transmission Mechanism:
Geopolitical Shock → Higher Inflation → Tight Monetary Policy → Household & Labor Weakness → CRE & Housing Stress → Banking Pressure → Credit Tightening → Economic Slowdown
Sector-Level Risk Assessment
Household Sector
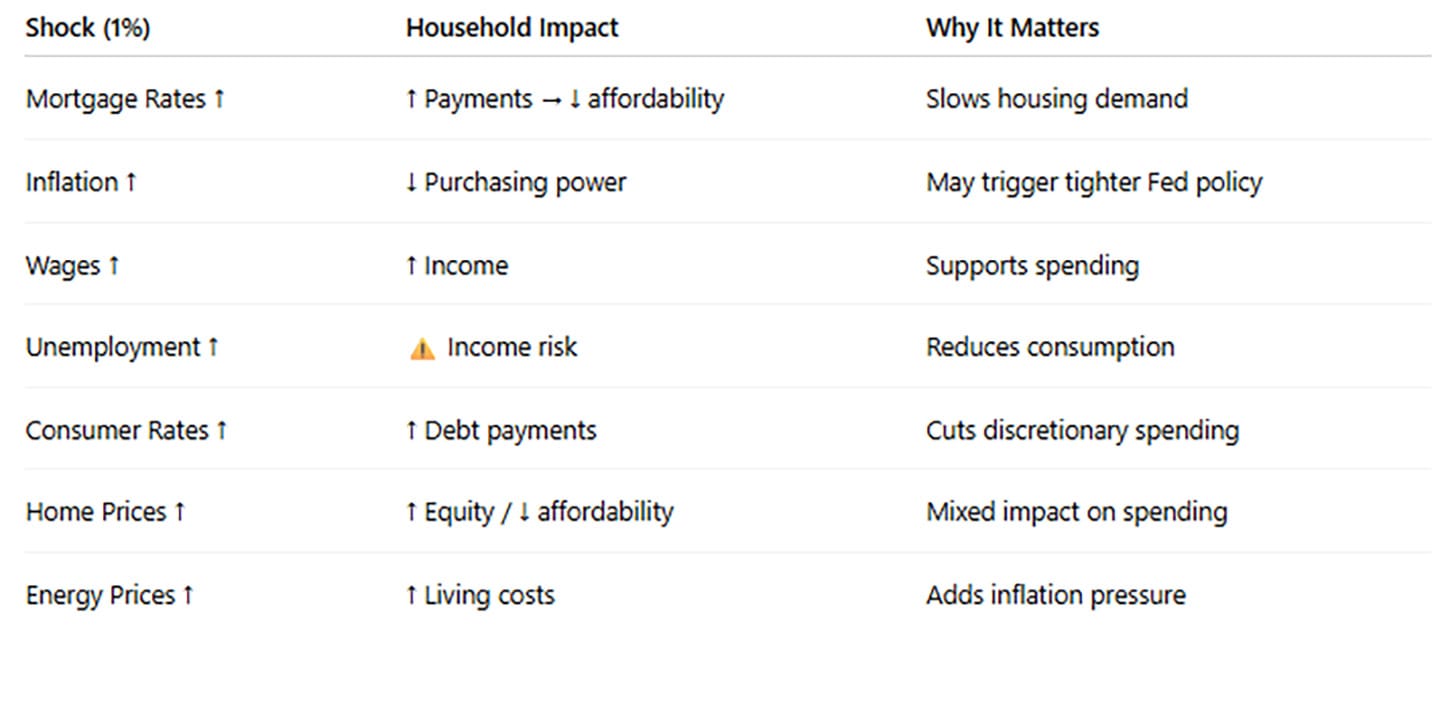
Higher interest rates have increased borrowing costs across mortgages, credit cards, and auto loans. Combined with declining savings and weaker confidence, households have reduced capacity to absorb economic shocks.
A modest increase in borrowing costs or inflation can meaningfully impact disposable income. For example, a 1% increase in costs may add approximately $750 annually for a median-income household.
Commercial Real Estate (CRE)
CRE markets remain under pressure, particularly in the office sector, due to remote work trends, higher interest rates, and elevated vacancy levels.
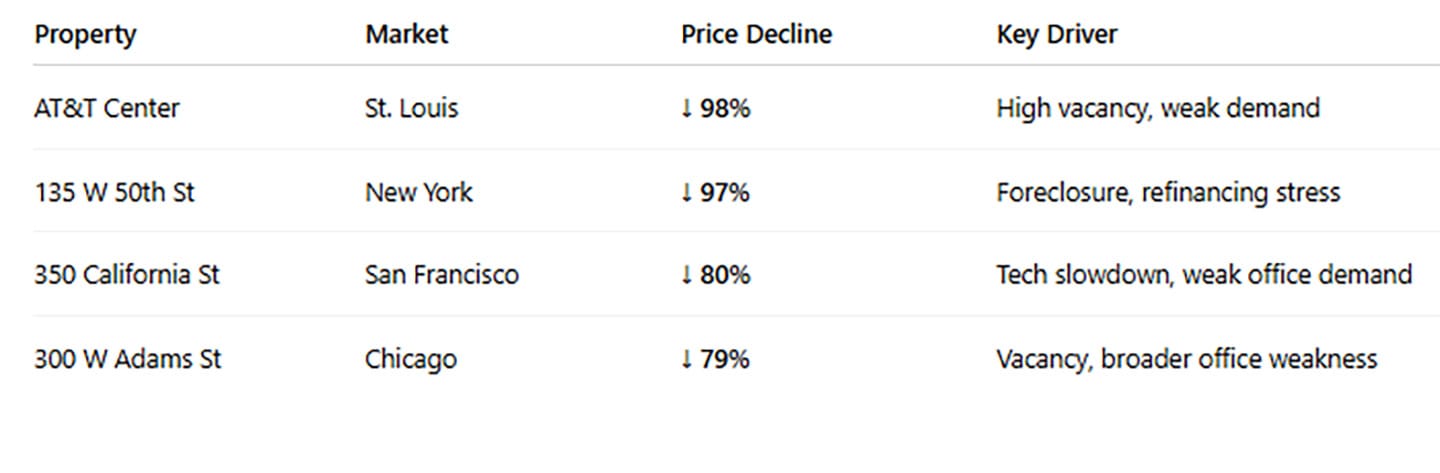
Office valuations have declined significantly from peak levels
Refinancing risks remain elevated
Regional banks face concentrated exposure
These dynamics may contribute to tighter lending conditions and reduced investment activity.
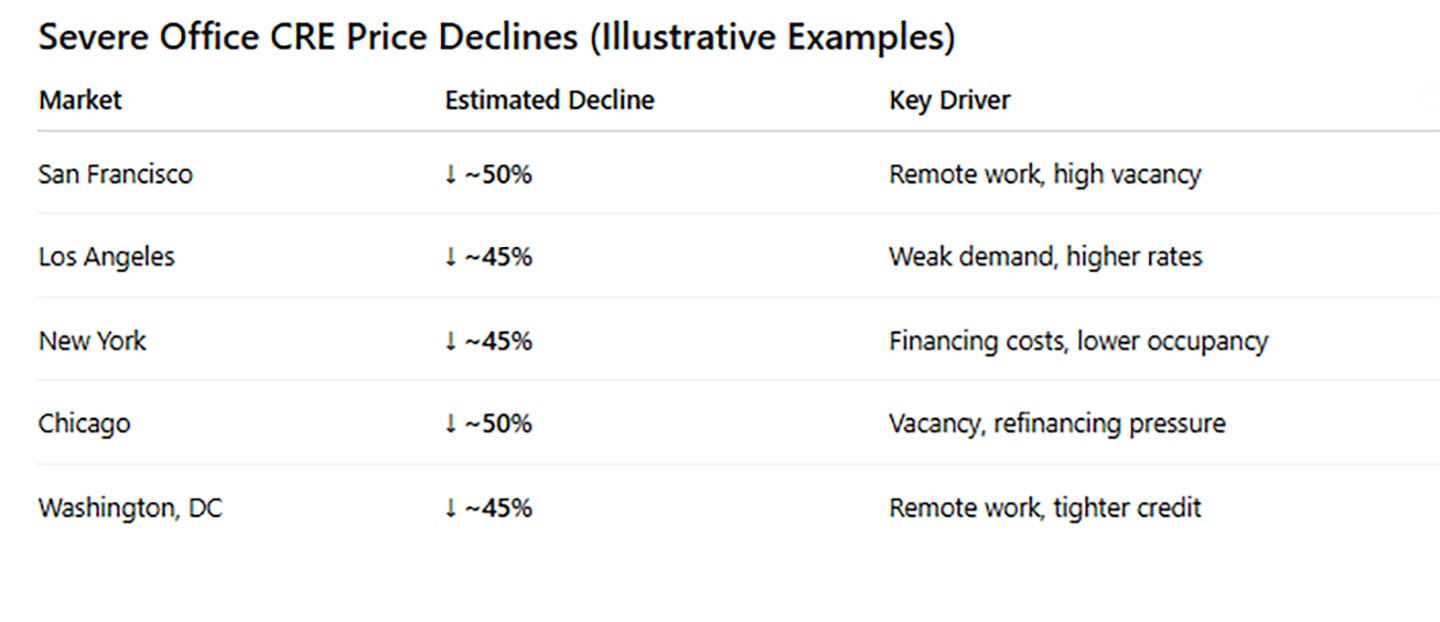
Office valuations have declined significantly (typically 20–50%), with more severe declines observed in distressed assets, reflecting remote work, higher rates, weak demand, and refinancing pressures. Given regional banks’ significant CRE exposure, further declines could elevate credit risk, tighten lending, and weigh on investment and growth.
Taken together, declining CRE valuations, rising consumer credit, persistent inflation, higher rates, elevated government debt, and low household savings heighten financial vulnerabilities and could amplify credit risks and deepen a future downturn.
Macroeconomic trends are likely to create several practical challenges for households:
Higher borrowing costs across mortgages, credit cards, and auto loans
Slower wage growth amid weakening economic activity
Reduced financial buffers due to low savings and rising debt
What a 1% Change Means for a Typical U.S. Household
Small changes in rates, inflation, and employment can have meaningful impacts on household finances and spending behavior.
Tightening financial conditions, household balance sheet strain, and rising CRE risks are likely to increase the risk of economic slowdown and financial stress over the 2026–2031 cycle.
Taken together, these indicators suggest the U.S. economy is entering a more vulnerable phase, with slower growth and rising financial stress elevating recession risk amid tighter credit or external shocks.
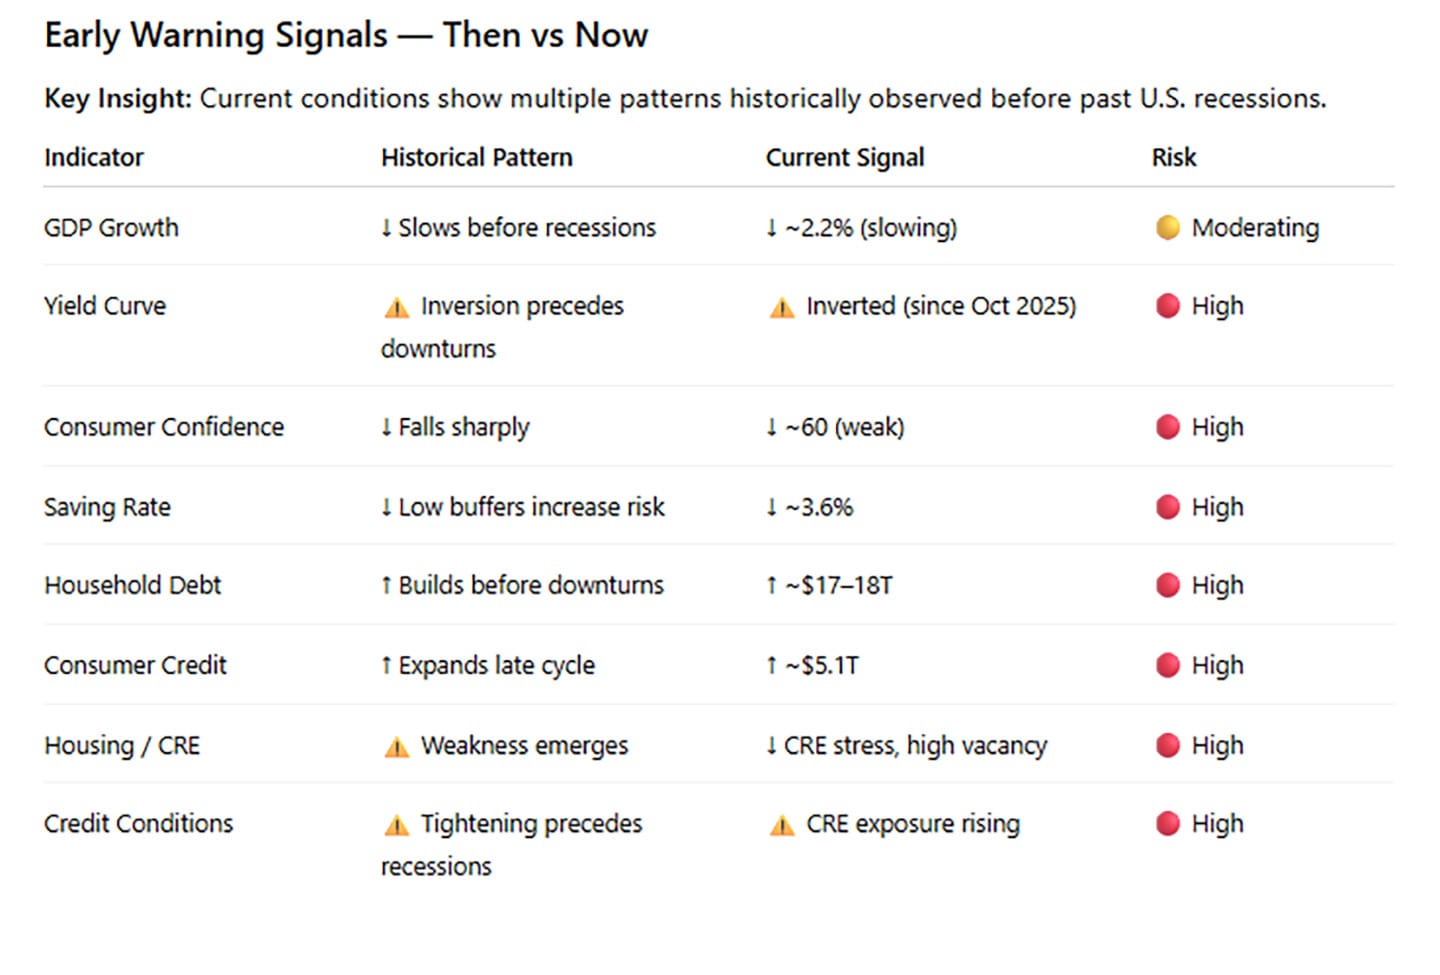
While expansion remains possible, rising macro and financial vulnerabilities point to elevated downside risks, with tighter conditions or sector stress increasing the risk of slower growth or downturns over the 2026–2031 period.
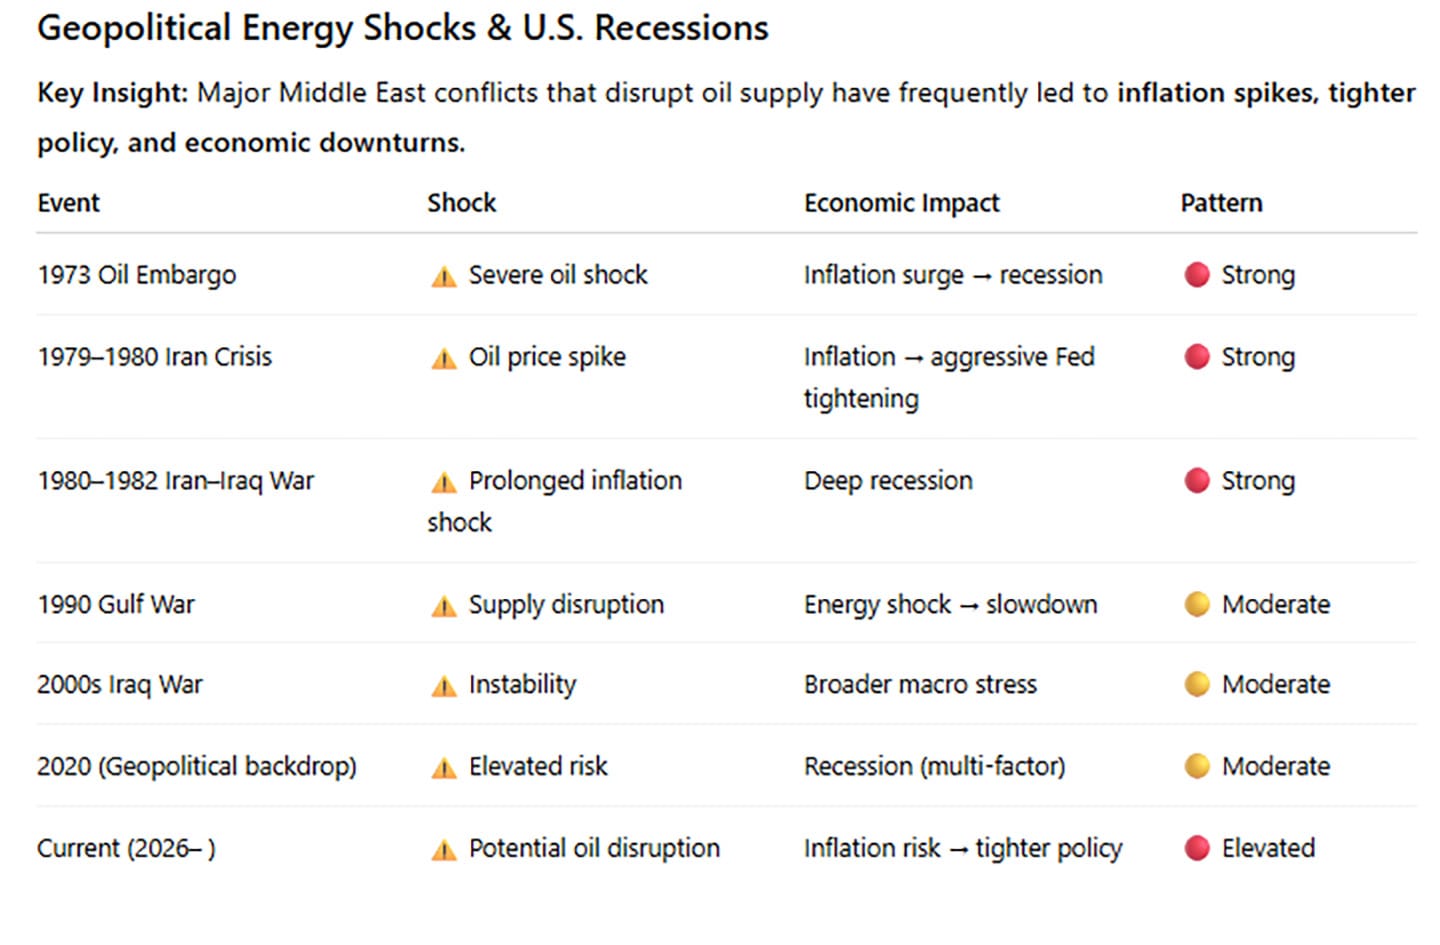
Geopolitical and Energy Market Risks
Geopolitical tensions in the Middle East remain a key macro risk. Historically, energy supply disruptions have contributed to:
Higher inflation
Tighter monetary policy
Slower economic growth
In the current environment, such risks are amplified by already tight financial conditions and elevated debt levels. As a result, energy shocks could have a more pronounced impact than in earlier cycles.
Investment Implications
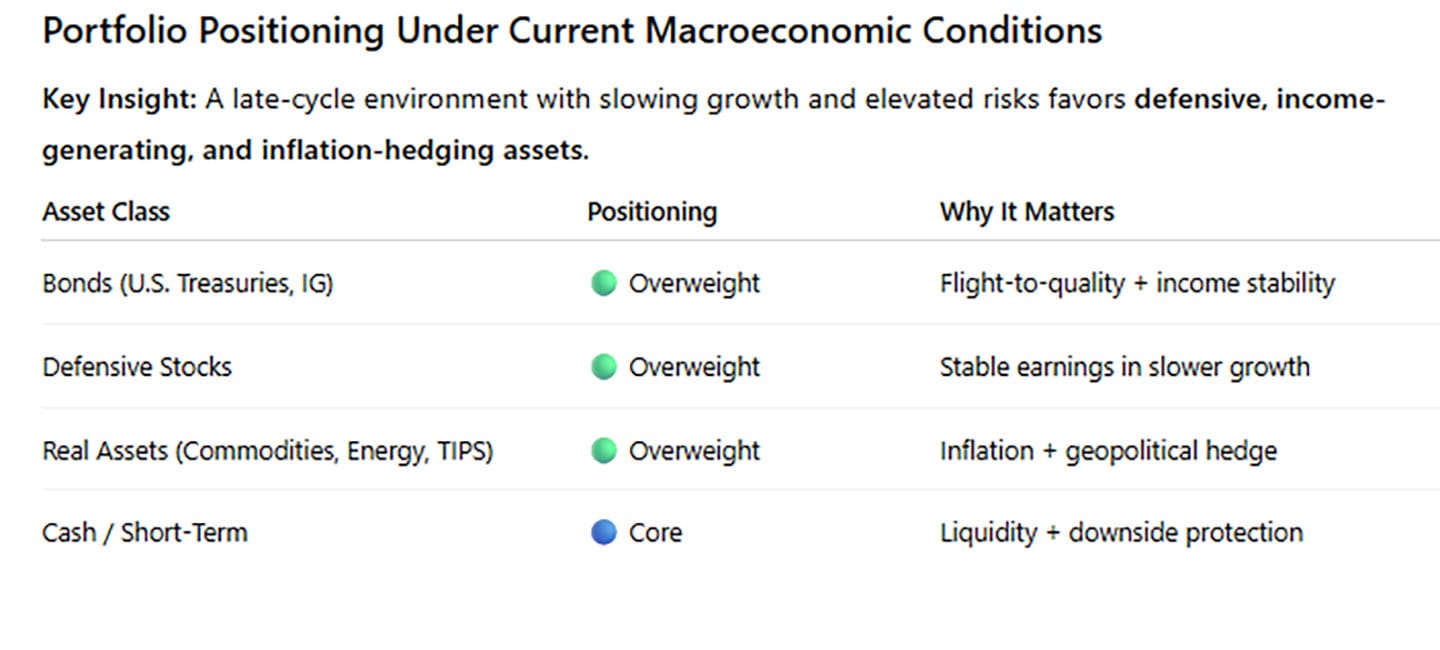
In a late-cycle environment characterized by moderating growth and elevated uncertainty, portfolio positioning should emphasize resilience and flexibility.
Key positioning themes (6–12 months):
High-Quality Fixed Income: Attractive for income and capital preservation
Defensive Equities: Focus on stable earnings and pricing power
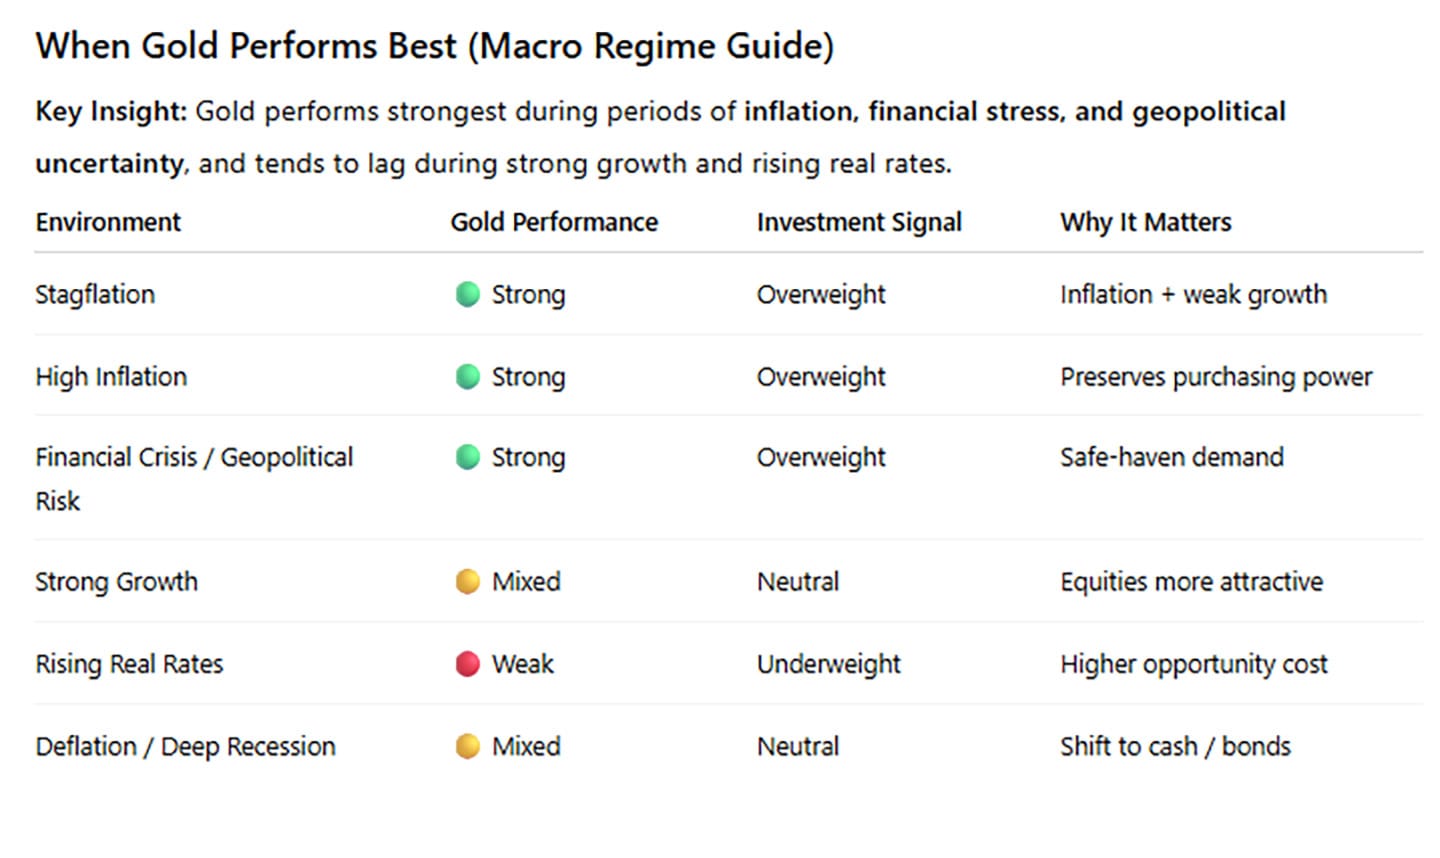
Inflation Hedges: Commodities, energy, TIPS, and gold
Liquidity: Maintain flexibility to navigate volatility
Overall, we recommend a balanced and moderately defensive allocation, with selective exposure to inflation-sensitive assets.
Amid moderating growth, inflation uncertainty, tight financial conditions, and geopolitical risks, a diversified portfolio—balancing defensive equities, high-quality fixed income, inflation-sensitive assets, and liquidity—can help manage downside risks while preserving flexibility.
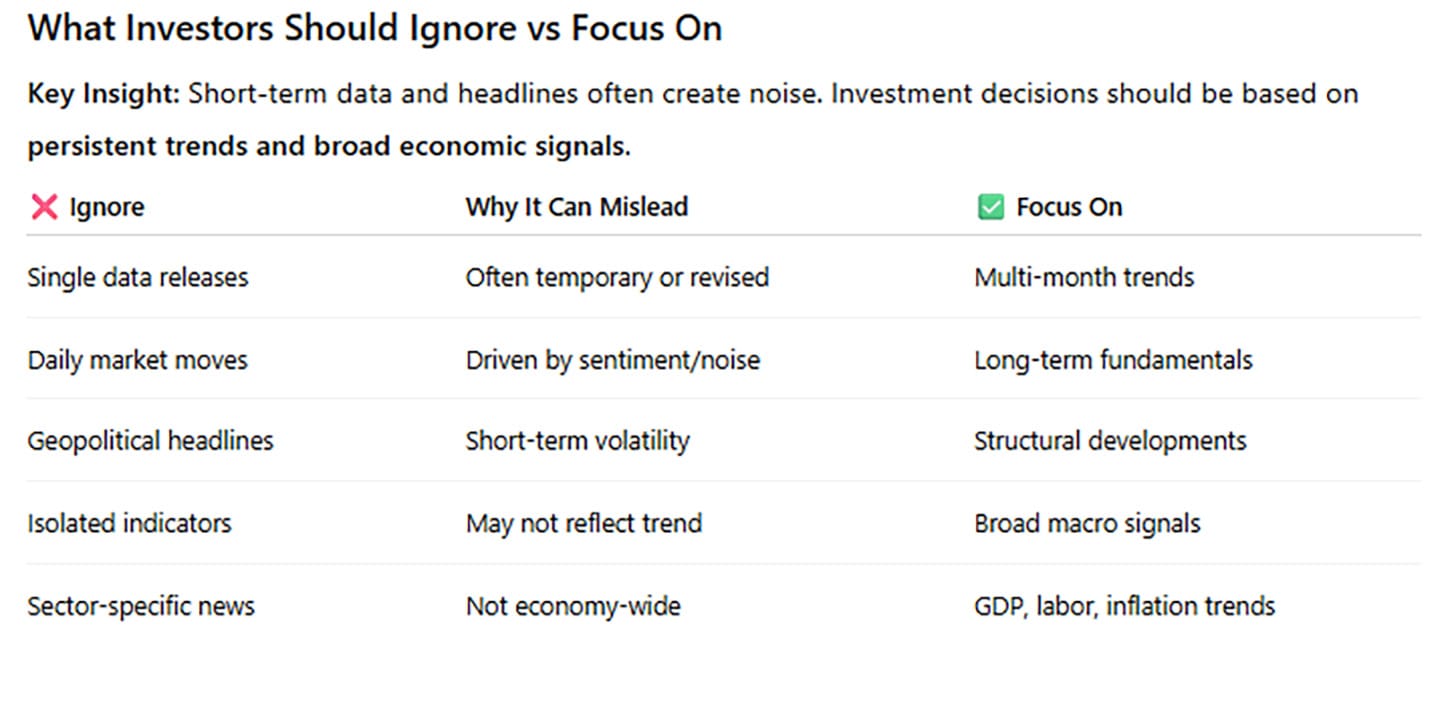
Investors should look through short-term volatility and focus on long-term trends in growth, labor, inflation, and financial stability to guide investment decisions.
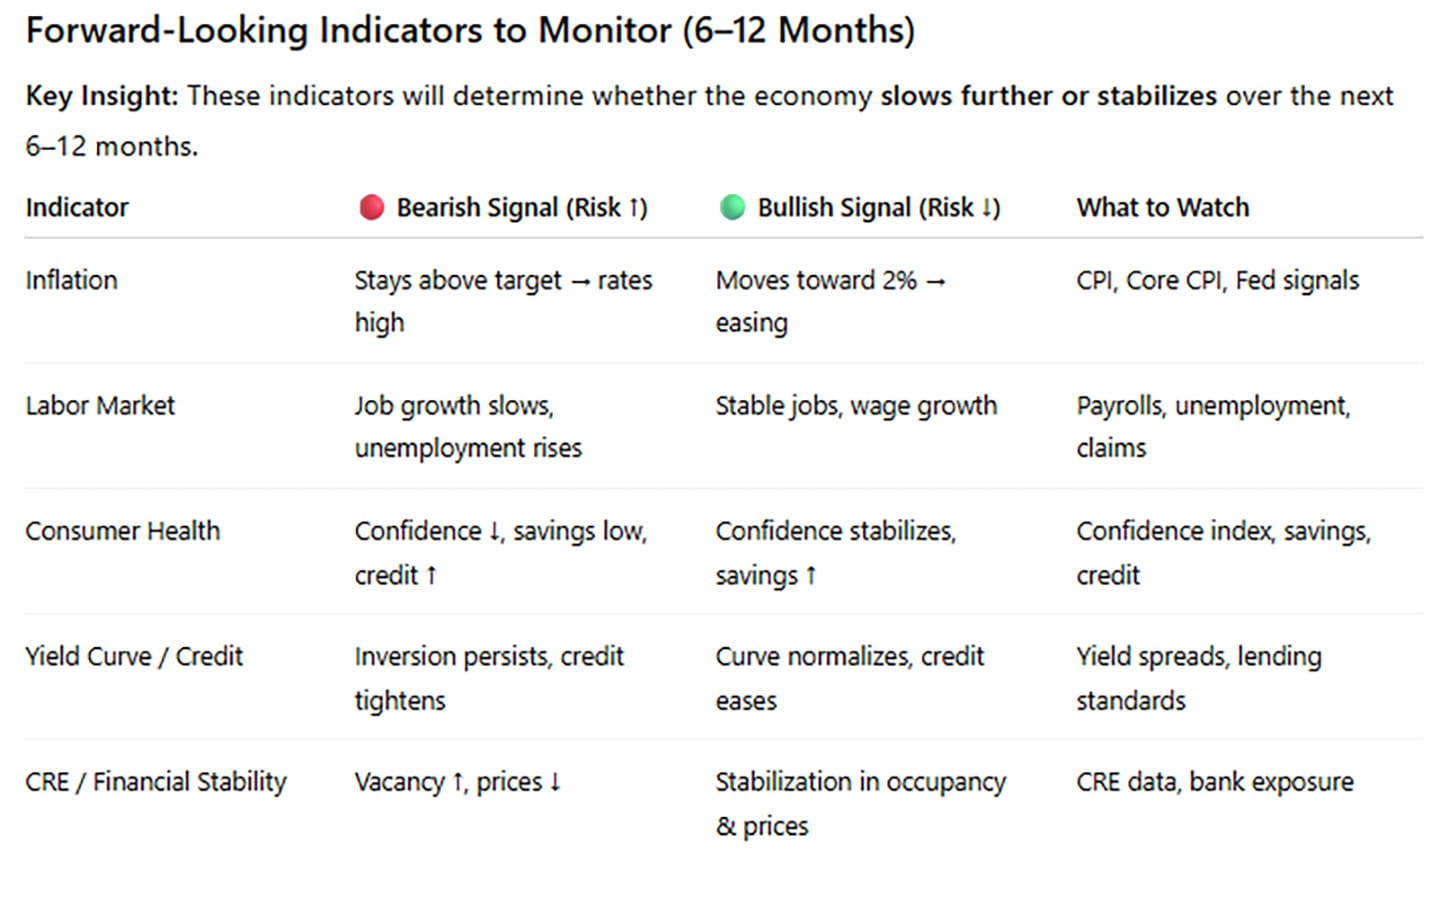
Forward-Looking Outlook (6–12 Months)
The economic outlook will depend on several key factors:
Inflation trajectory and Federal Reserve policy
Labor market resilience
Consumer spending trends
CRE and credit market developments
Geopolitical impacts on energy supply
These indicators will determine whether the economy:
Gradually slows (base case)
Stabilizes with moderate growth
Experiences a sharper downturn under tighter financial conditions or external shocks
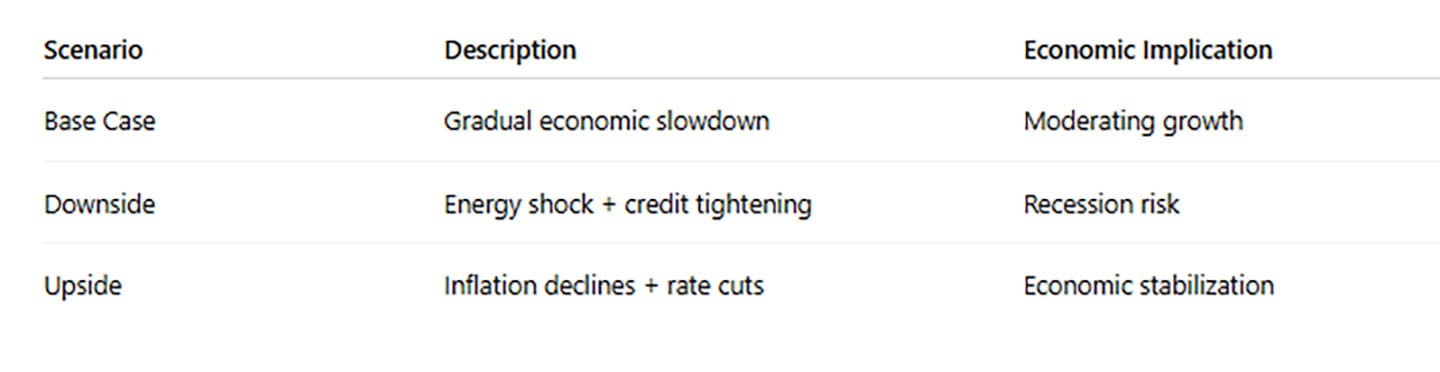
Scenario Analysis: The following scenarios outline potential economic outcomes over the next 6–12 months under varying paths for inflation, financial conditions, and geopolitical risks.
Final Conclusion
The U.S. economy remains in expansion but is entering a more fragile stage of the business cycle. While a recession is not imminent, weakening household fundamentals, tight financial conditions, and geopolitical risks increase the probability of slower growth.
Maintaining diversification, emphasizing high-quality assets, and preserving liquidity will be essential for navigating this evolving environment.
Appendix:
Data Sources
Economic data referenced in this report are sourced primarily from FRED (Federal Reserve Economic Data) provided by the Federal Reserve Bank of St. Louis.
Figure 1 — U.S. Government Debt
U.S. federal debt has risen sharply over the past two decades, especially after the 2008 Global Financial Crisis and the COVID-19 pandemic due to large fiscal stimulus programs. While these measures supported economic stability, higher debt increases interest costs and may limit fiscal flexibility in responding to future shocks.
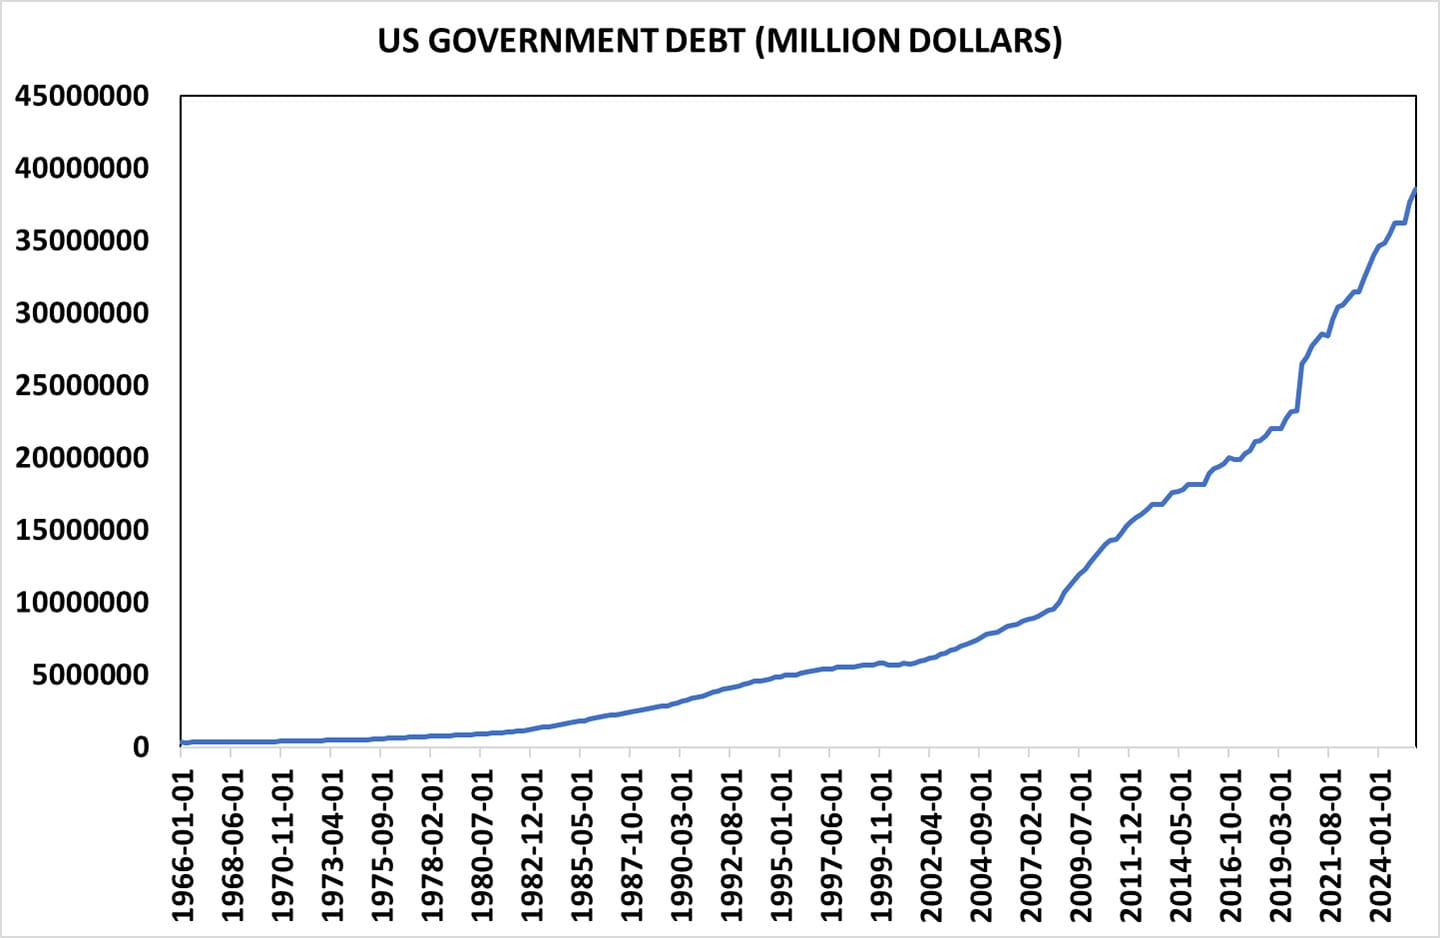
Figure 2 — Expansion of the Money Supply During COVID
During the COVID-19 pandemic, large-scale monetary and fiscal stimulus expanded the U.S. money supply by approximately $5.3 trillion, significantly increasing liquidity and contributing to lower interest rates. From the perspective of first-generation financial crisis models, sustained monetary expansion combined with fiscal imbalances can heighten the risk of inflationary pressures and financial instability, particularly if underlying economic fundamentals weaken.
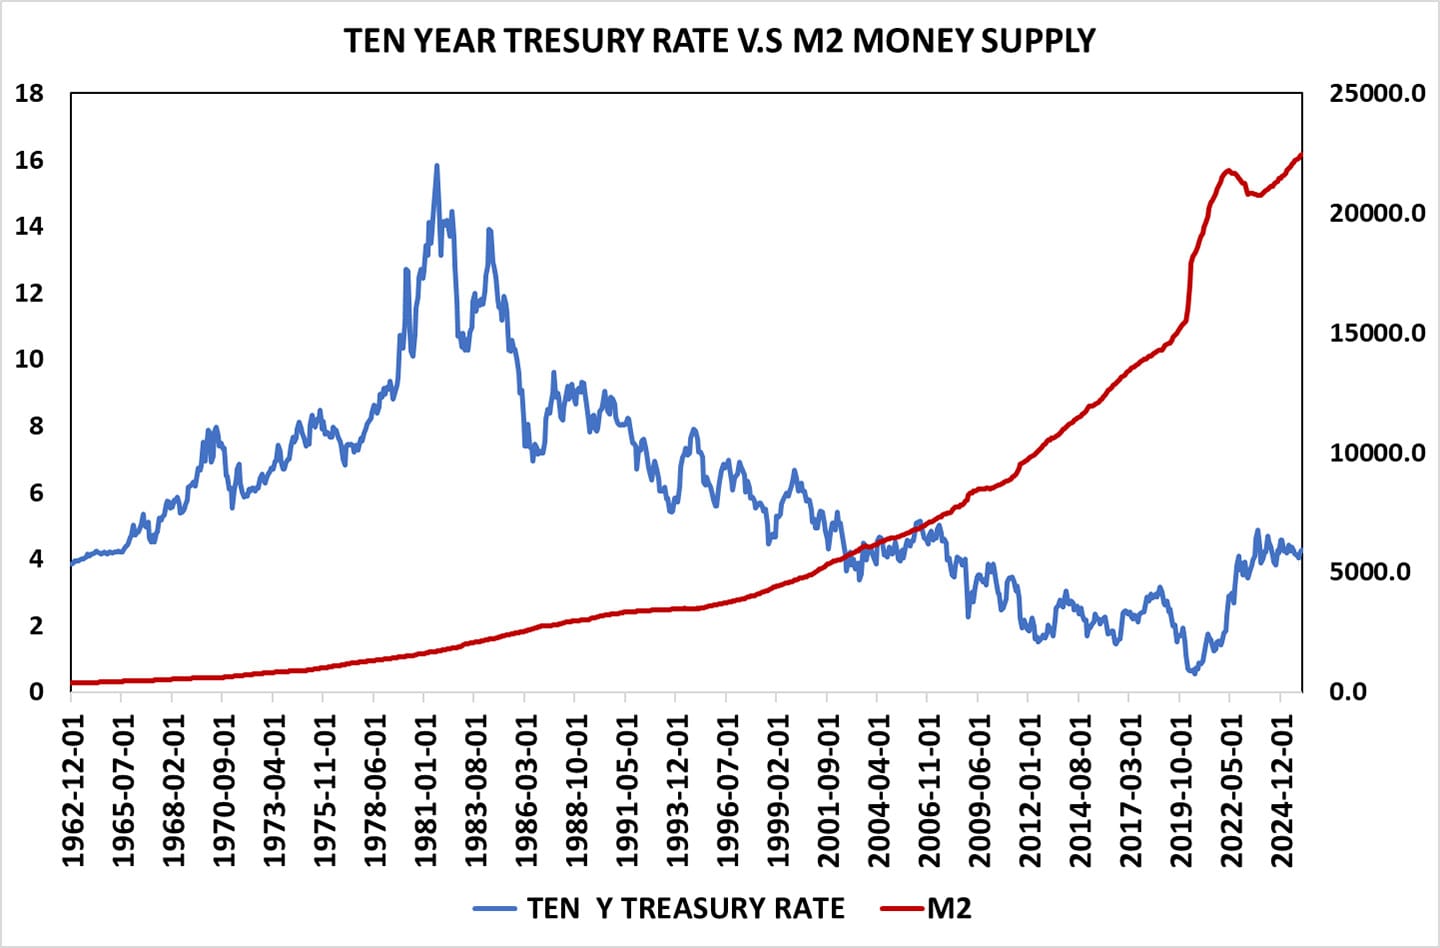
Figure 3 — Decline in Composite Consumer Confidence Index
Consumer confidence has declined over the past year, signaling weaker household optimism and potentially more cautious spending. Because consumer spending accounts for about 70% of U.S. economic activity, falling confidence may indicate slower consumption growth. Moving-average trends (3-, 6-, and 12-month) suggest a sustained decline in sentiment, which historically has preceded weaker economic activity.
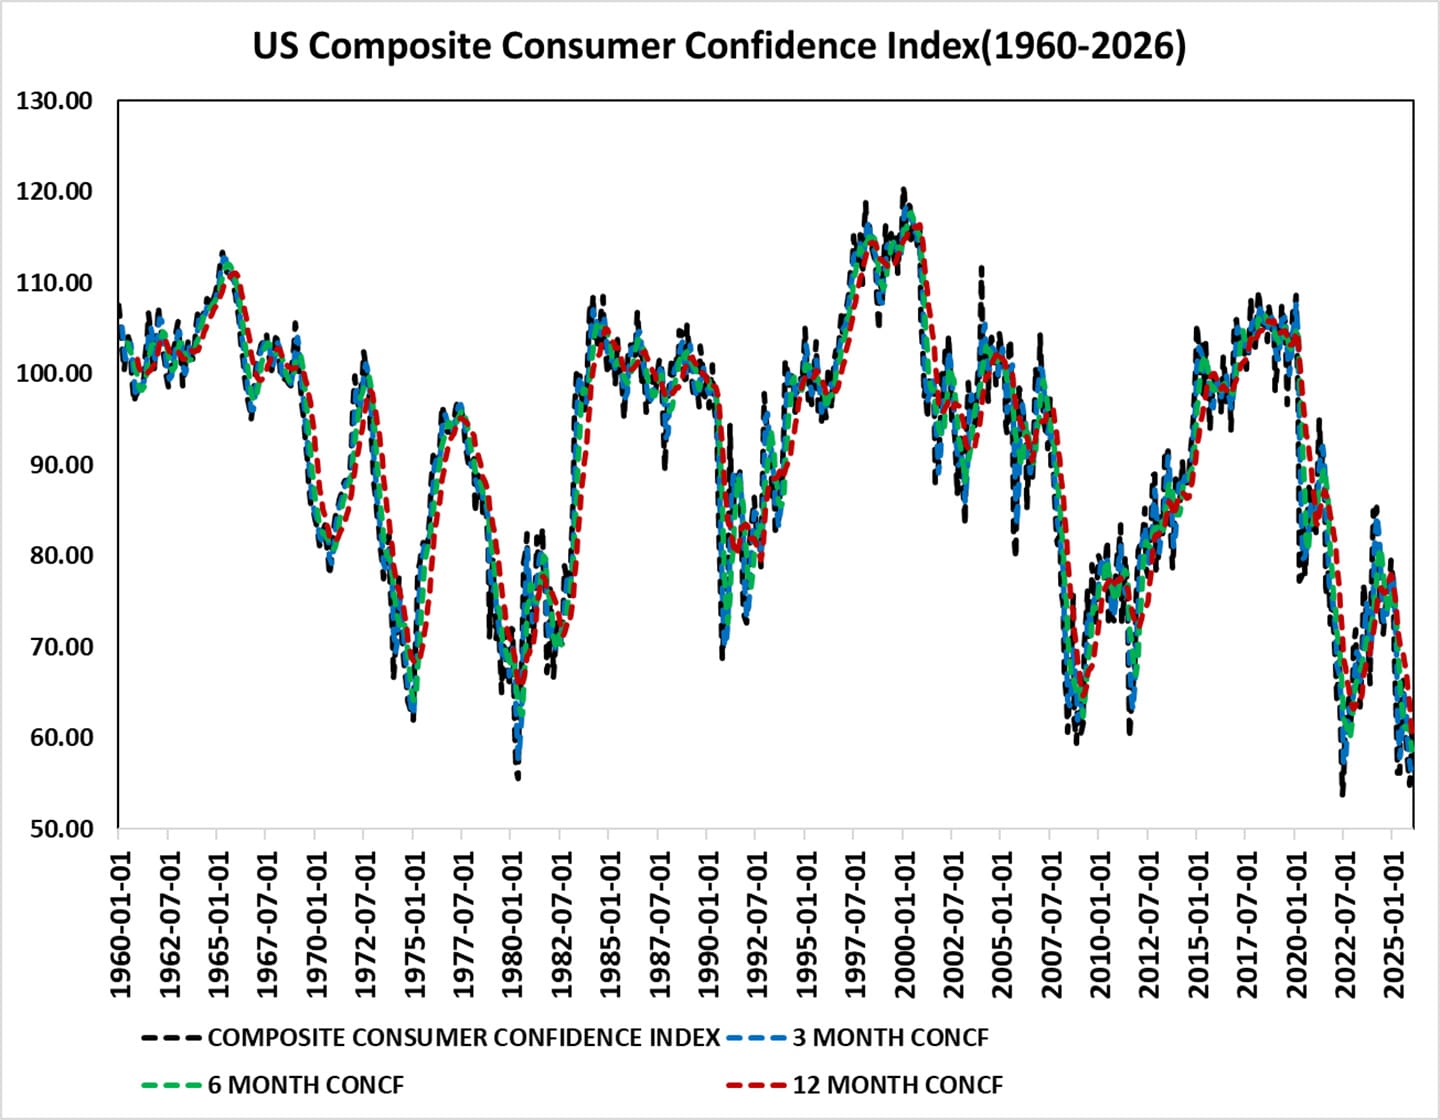
Figure 4 — Low Personal Saving Rate
The personal saving rate measures the share of household income saved rather than spent. By the end of 2025, it had fallen to about 3.6%, well below the historical 6–8% range, indicating reduced financial buffers. Persistently low savings may limit households’ ability to absorb economic shocks and could contribute to slower consumer spending and weaker economic growth.
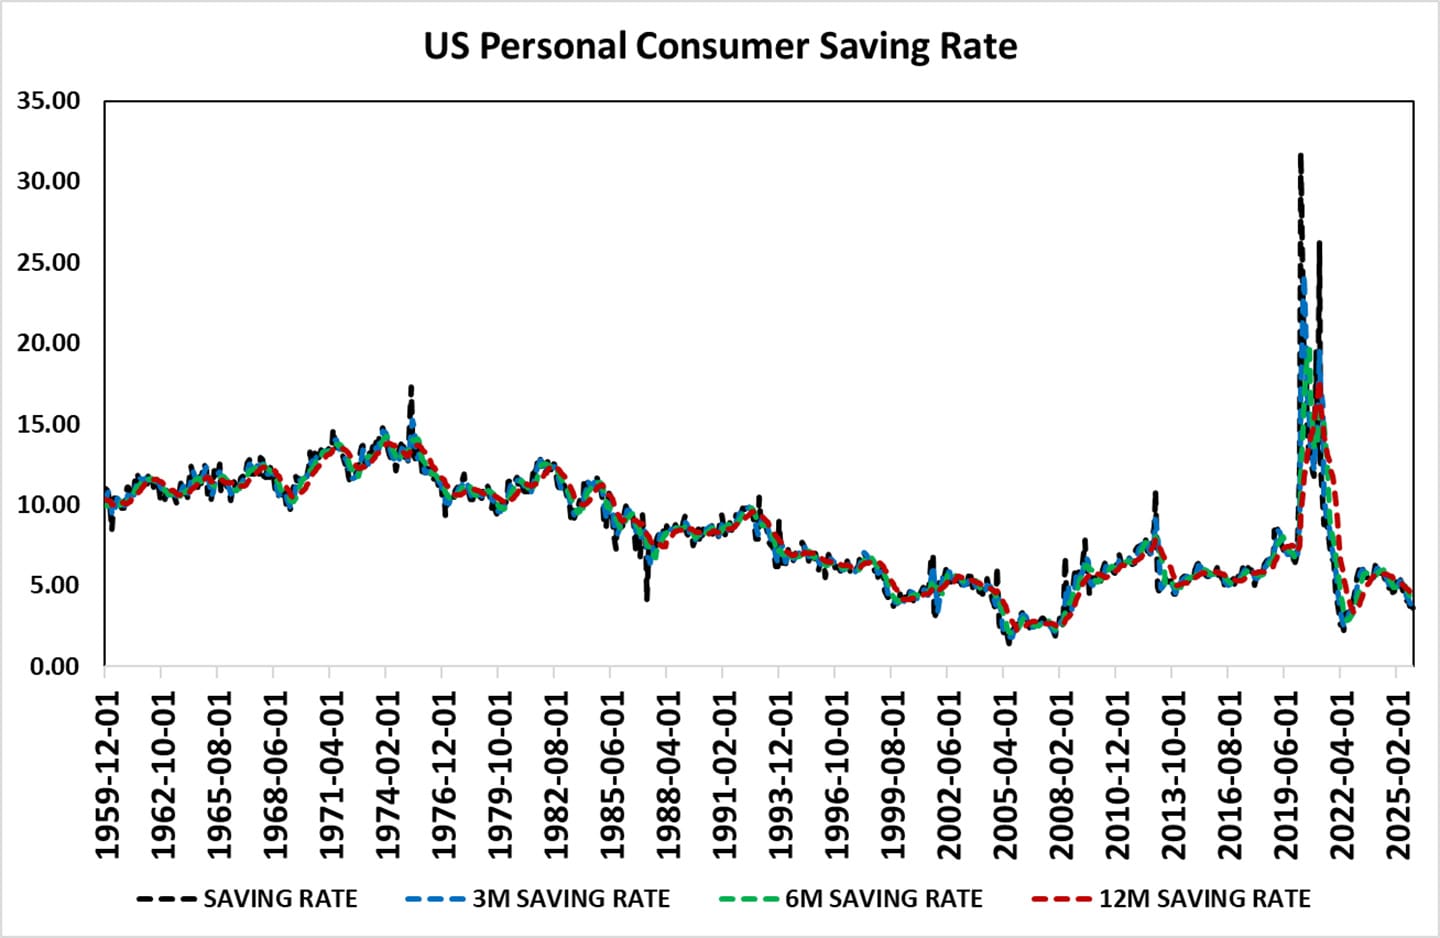
Figure 5 — Unemployment During Major U.S. Economic Crises
Major economic shocks have historically caused sharp increases in U.S. unemployment. The rate rose to 10.8% in 1982 during the stagflation period, 10% during the 2008 Global Financial Crisis, and nearly 15% during the COVID-19 pandemic in 2020. These episodes show how major shocks can quickly weaken labor markets and contribute to broader economic downturns.
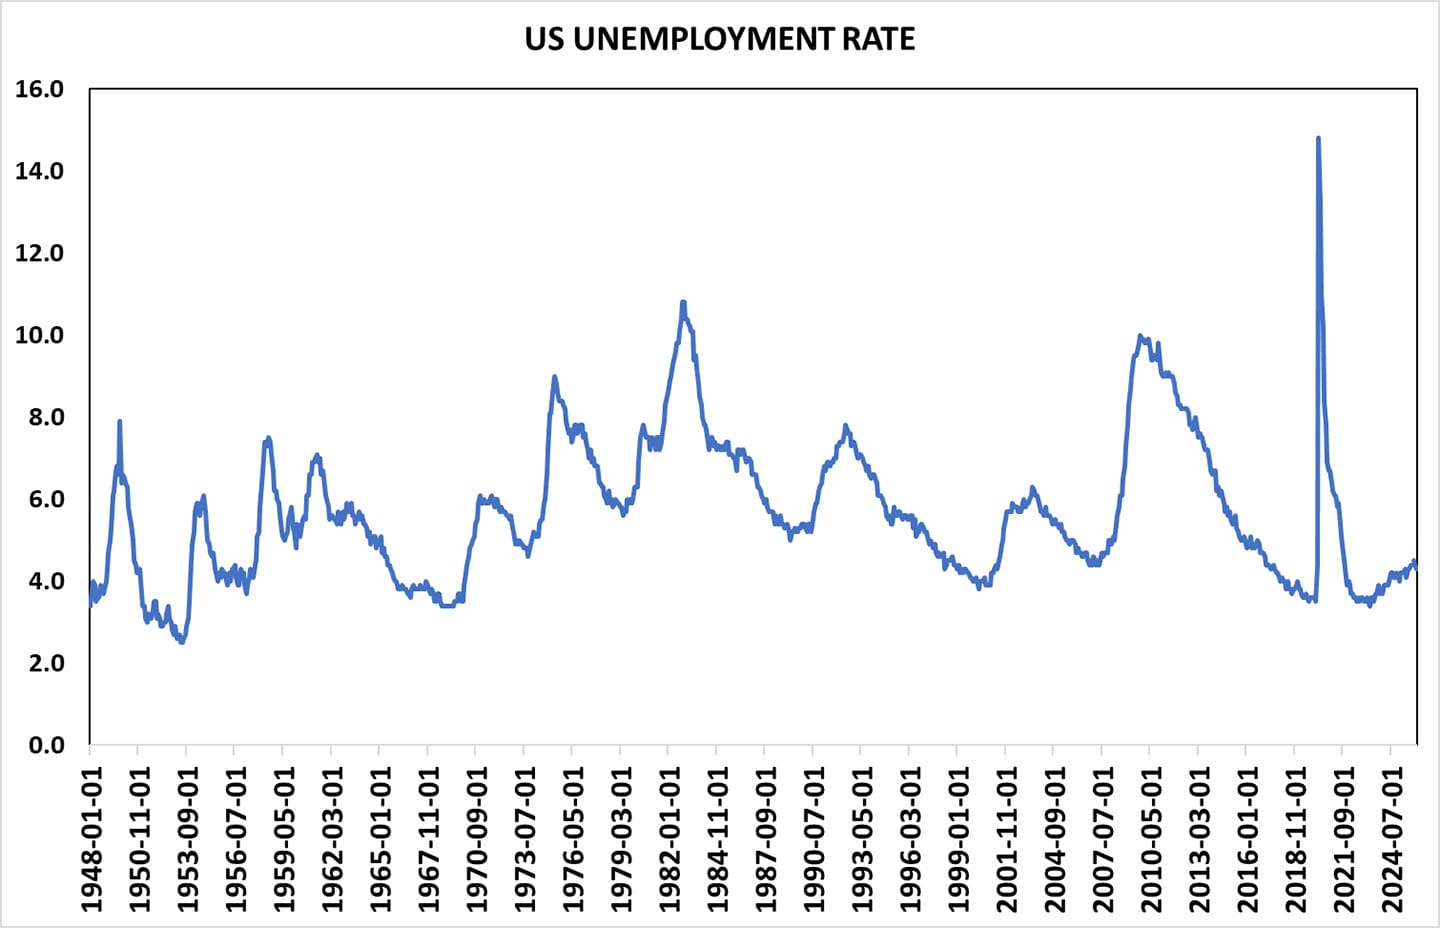
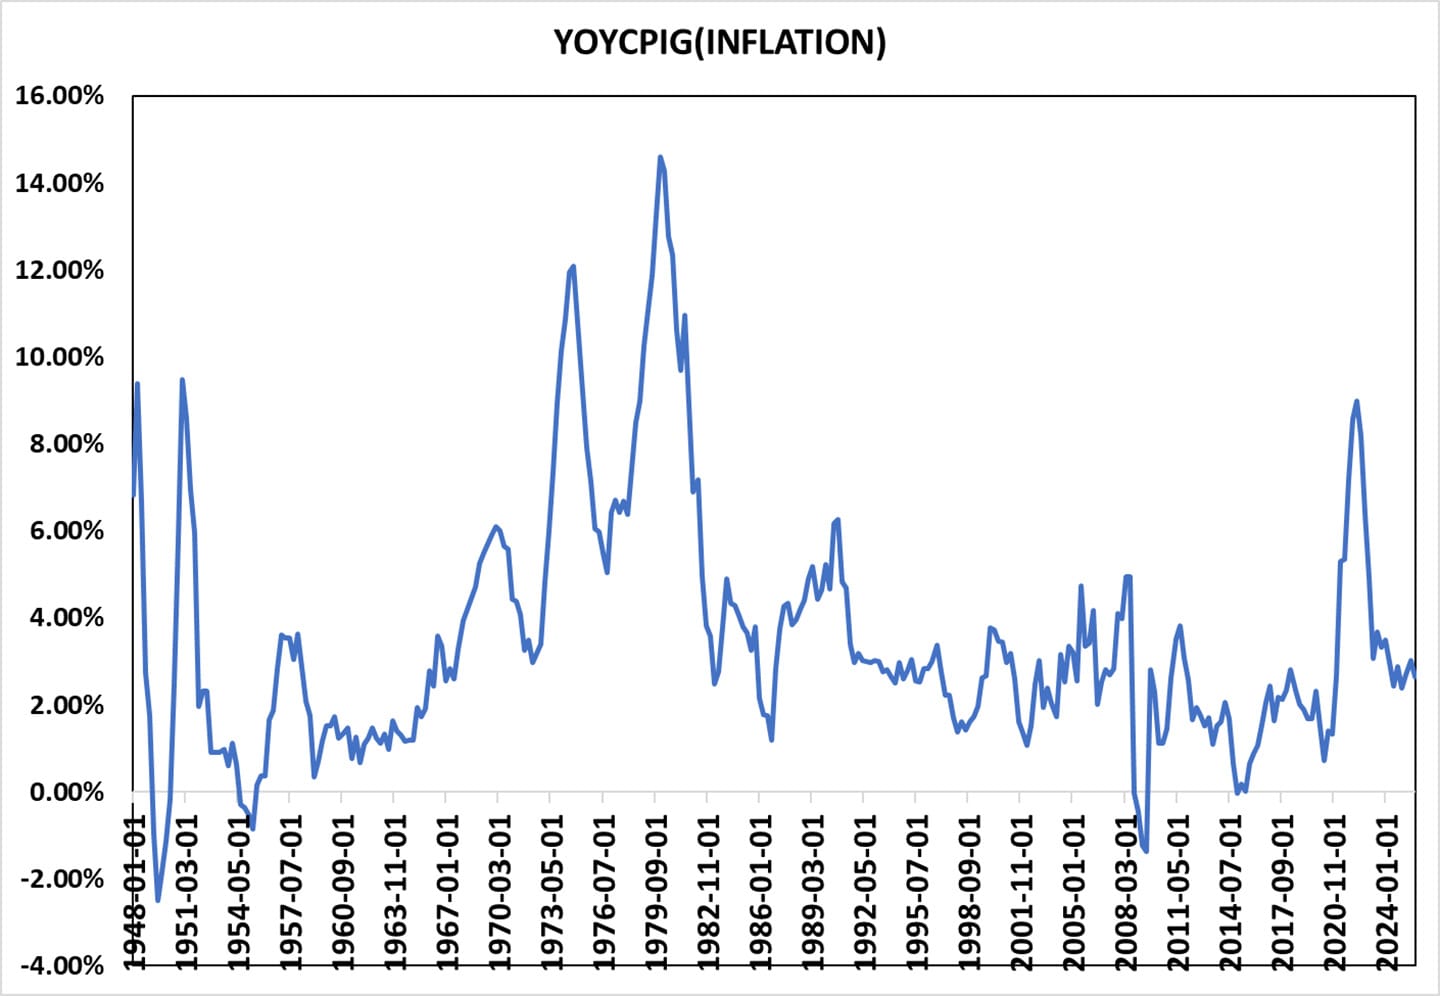
Figure 6 — Inflation During the 1970s–1980s Compared with Recent Periods
Inflation peaked above 14% in 1980 during the stagflation period, driven largely by energy shocks and geopolitical instability. In contrast, inflation remained subdued during the 2008 Global Financial Crisis but rose sharply after the COVID-19 pandemic due to fiscal stimulus, supply disruptions, and strong demand. These episodes show how inflation is influenced by energy shocks, policy responses, and broader macroeconomic conditions.
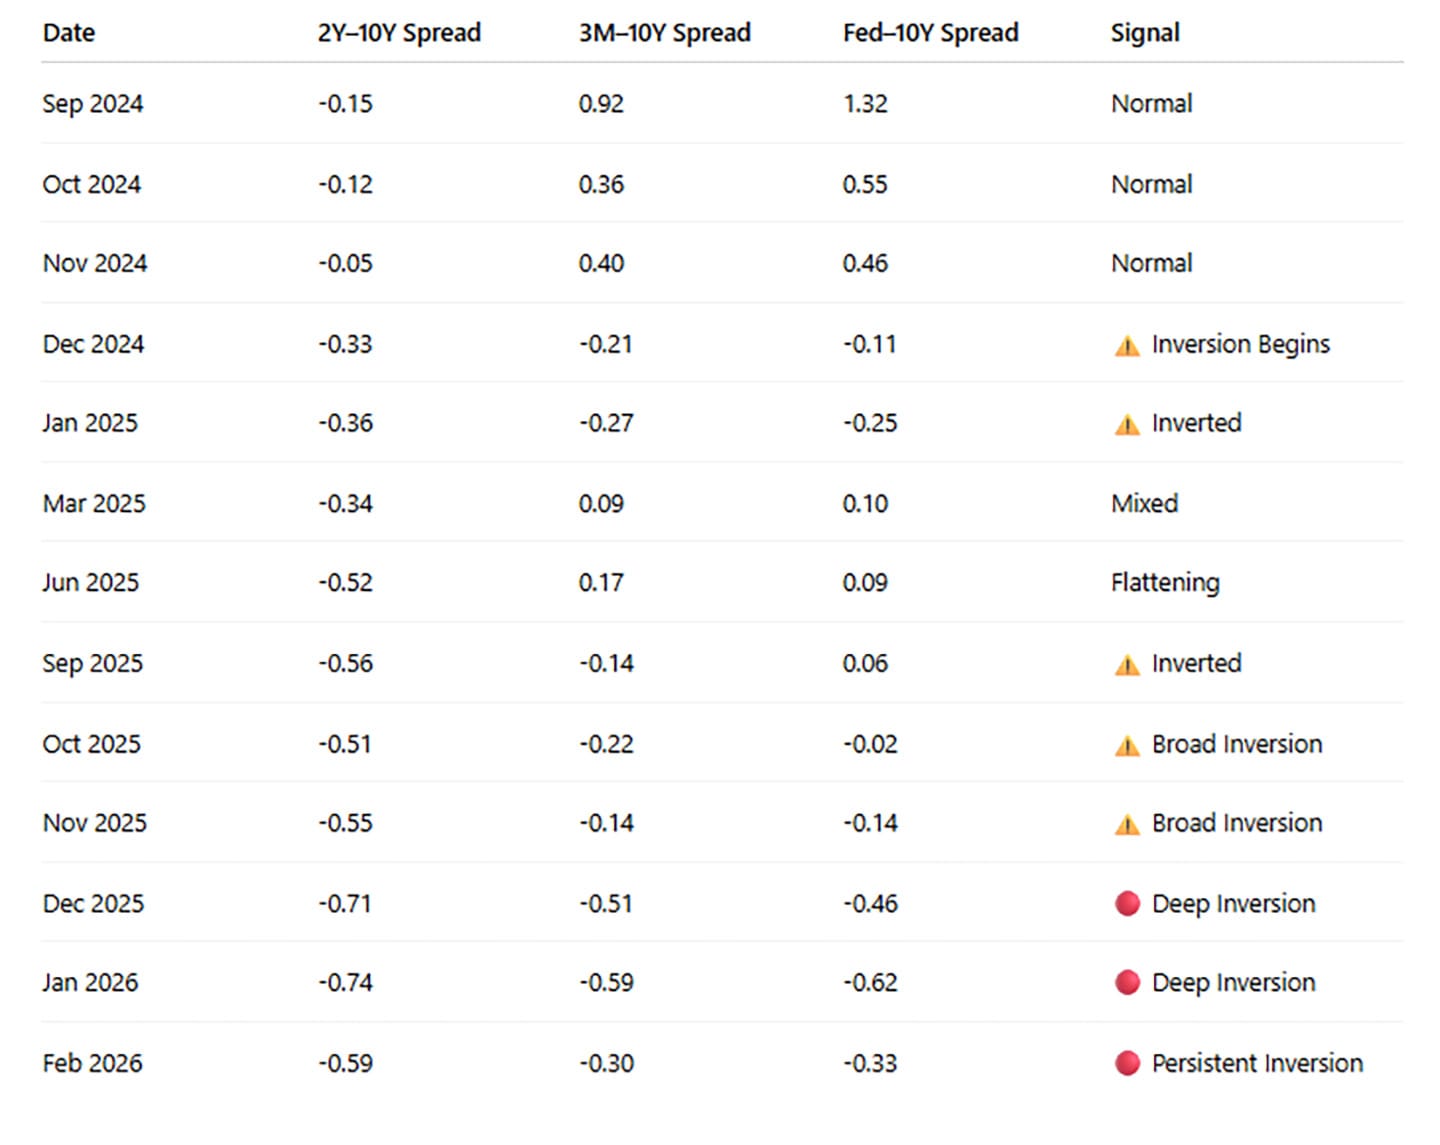
Persistent Inversion of the U.S. Treasury Yield Curve
The U.S. Treasury yield curve has remained persistently inverted since October 2025. The yield curve reflects the difference between short-term and long-term U.S. Treasury interest rates and is widely used as a leading indicator of future economic conditions.
In summary, the U.S. economy remains on an expansionary path but is increasingly characterized by late-cycle fragility, with structural imbalances and tightening financial conditions elevating downside risks. The convergence of weakened household balance sheets, persistent yield curve inversion, commercial real estate stress, and constrained fiscal flexibility creates a more sensitive environment in which even modest shocks—particularly from geopolitics or energy markets—could have amplified effects. While a recession is not the base case, the margin for error has narrowed meaningfully. In this context, prudent portfolio construction, disciplined risk management, and a focus on quality and liquidity are essential, as investors navigate a transition from resilient growth toward a more uncertain and potentially volatile phase of the economic cycle.
—
What Investors Are Asking Right Now
Is the U.S. heading into a recession in 2026?
A recession is not the base case, but the conditions that would amplify one are increasingly in place. Household savings have fallen to 3.6%, well below the historical 6 to 8% range. The yield curve has been inverted since October 2025, historically a reliable signal of slower growth within 6 to 18 months. The economy can continue expanding, but the margin for error is narrower than it has been in recent years. A geopolitical shock, an energy disruption, or further credit tightening could accelerate a slowdown more quickly than prior cycles would suggest.
How should I position my portfolio in a late-cycle economy?
Late-cycle environments reward quality and liquidity over growth and concentration. High-quality fixed income becomes more attractive for both income and capital preservation. Defensive equities with stable earnings and pricing power hold up better than cyclical exposure. Inflation-sensitive assets including commodities, energy, TIPS, and gold provide a hedge against the energy and geopolitical risks currently elevated in this cycle. Maintaining enough liquidity to act during volatility, rather than being forced to sell into it, is as important as any specific allocation decision.
What does yield curve inversion mean for my investments?
An inverted yield curve means short-term interest rates are higher than long-term rates, which is the opposite of normal conditions. It signals that bond markets expect growth to slow and rates to eventually fall. Historically it has preceded economic slowdowns by 6 to 18 months with reasonable consistency. For investors, it matters less as a prediction and more as a risk flag: when the yield curve is inverted and household balance sheets are stretched simultaneously, the environment is less forgiving of portfolio risk than it appears on the surface.
DISCLOSURE:
Fulcrum Wealth Advisors, LLC (FWA) is a registered investment adviser registered with the U.S. Securities and Exchange Commission (“SEC”). Registration with the SEC does not imply a certain level of skill or training. The firm is not registered as a broker-dealer and is not affiliated with any broker-dealer.
Advisory services are provided only to clients who enter into a written advisory agreement with FWA. Investment advisory services are offered based on an individual client’s financial objectives, risk tolerance, and investment needs.
This material is provided for informational and educational purposes only and does not constitute personalized investment advice, a recommendation, or an offer to buy or sell any security. Any references to specific securities, asset classes, or investment strategies are for illustrative purposes only and may not be suitable for all investors.
Investing involves risk, including the possible loss of principal. Past performance is not indicative of future results. No investment strategy can guarantee profits or protect against losses in all market conditions.
Additional information about FWA, including its services, fees, and business practices, is available in the firm’s Form ADV, which is available on request or at www.adviserinfo.sec.gov